
Consider the scale of the global consumer economy: Mastercard processes about 22 million transactions every single hour. That’s 6200 transactions per second, i.e. about two-thirds of the 9,000 TPS (transactions per second) that Visa processes. Both of those companies are highly centralized institutions that act as single points of failure for the vast majority of monetary transactions taking place today. Of course, decentralized alternatives exist, but even if those cryptocurrency networks were user-friendly enough for everyday use, they’d have to be heavily optimized before being able to overtake traditional means of settling payments.
Meanwhile, your local dive bar is losing 2-3% of each sale to processing fees. This eats into their already thin margins and makes it harder for them to compete with a chain that can access economies of scale. If we don’t fix this soon, I’ll lose the only lesbian bar with an eight-dollar burger in a fifty-kilometre radius. Luckily, we run the testnets program for the Cosmos Hub, a crypto chain with a $2 billion dollar market cap, and thus have access to a network of highly-skilled validators that are willing to follow us into various madcap schemes to test out theories for solving scalability and performance issues.
The first step to solving any problem is to quantify it: how many transactions per second can the Cosmos Hub process today? On April 22, we ran a series of load tests (all reports for this slate of load tests are available here) with the aim of answering that question. We spun up a new chain and asked our testnet validators to start validating on it, giving everyone a similar stake. About 35 validators participated in the load tests, or about 20% of the 179-strong active mainnet set. We figure this is a reasonably fair representation of the Hub. Our load test used locust to create a large number of “bank sends” (i.e. the simplest “Alice gives Bob X dollars” type of transaction).
We found about 2000 users, each user sending a new transaction every five seconds, to be a sweet spot for load testing: just enough to cause a large volume of failures without overloading the system to where most transactions fail. Here’s an example of one such load test:
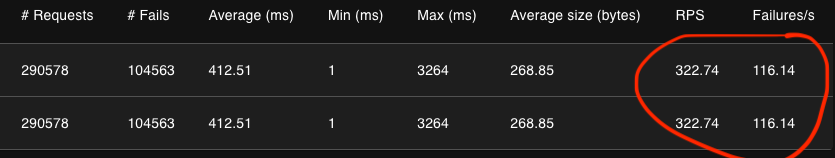
As you can see, we’re successfully processing about 322 - 116 = 206 transactions per second. That’s 3.3% of Mastercard. When you consider the relative size of either project–Mastercard vs the Cosmos Hub–it’s actually fairly impressive that we’re doing those numbers at all. However, we’re clearly still not at mass-adoption numbers. So, how do we increase throughput? A good starting point for a low-latency high-throughput Golang application is often to optimize memory allocation patterns. An application that asks for a lot of memory then stops using it just as quickly is going to see a lot of garbage collections (a garbage collection is when a program runs out of memory and has to go looking for chunks of memory it’s no longer using; this can stop execution in its tracks, as the program was trying to allocate new memory for a purpose and now has to stop and find room for it), each of which will take time away from transaction processing. We were able to use validator data to identify some of the biggest allocators in the blockchain:
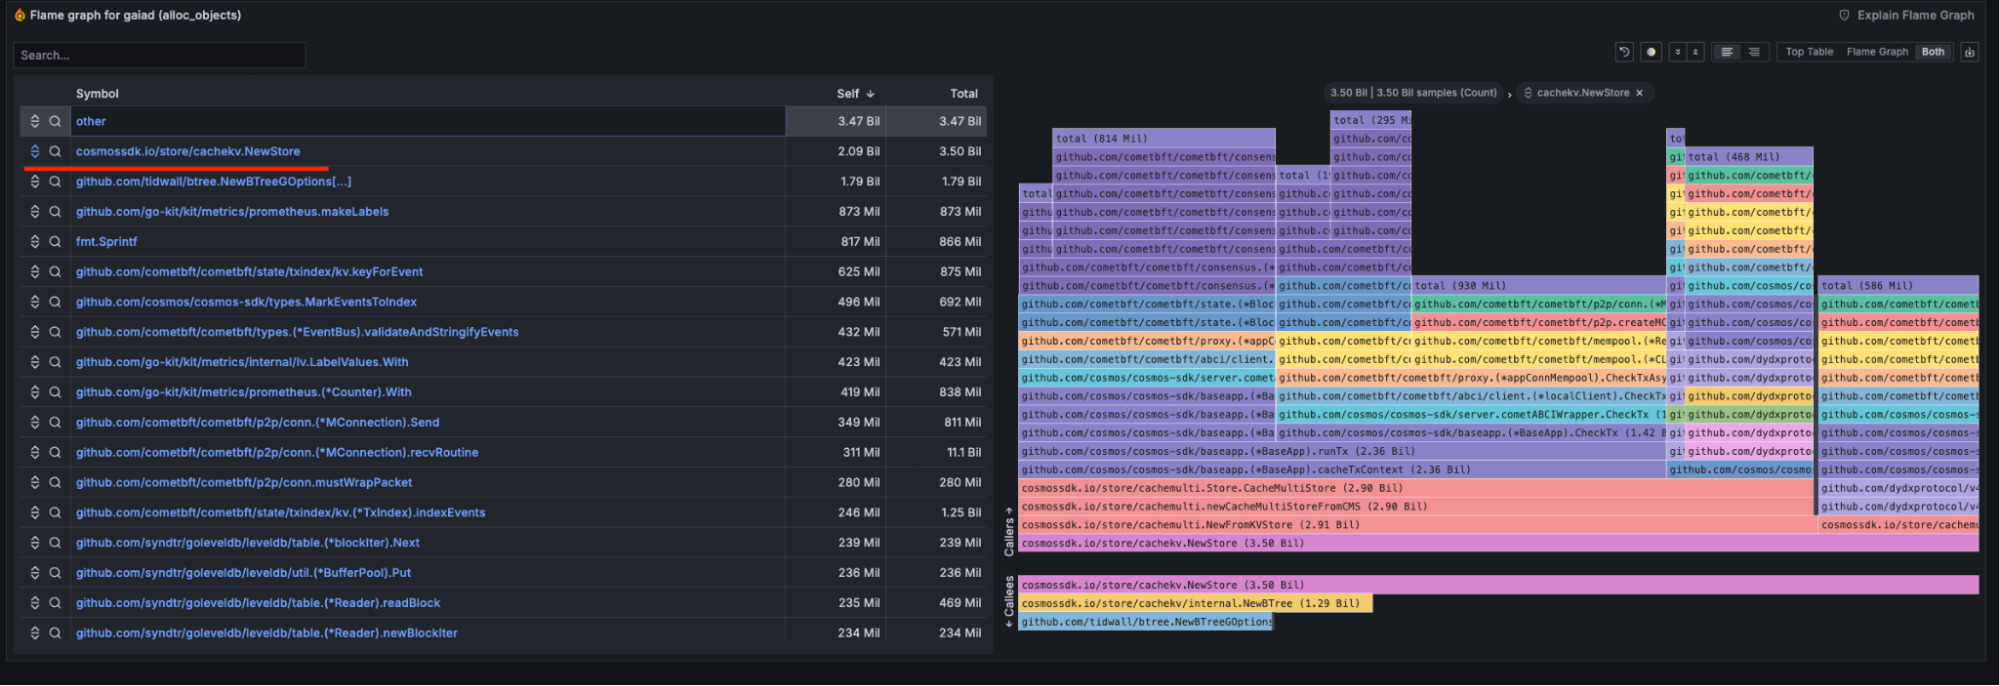
Notice how the top allocator in the application is the per-transaction cache (cachekv.NewStore). This makes sense: if we’re running a ton of transactions and each needs its own isolated cache, we’ll use a lot of caches. Indeed, the code path most affected by this is runTx, which is responsible for executing a single transaction. Luckily, this is actually fairly easy to fix: all we have to do is reuse the caches, making sure we clear them after each transaction. In other words, the memory is emptied out but remains allocated and ready to be used by the next transaction.
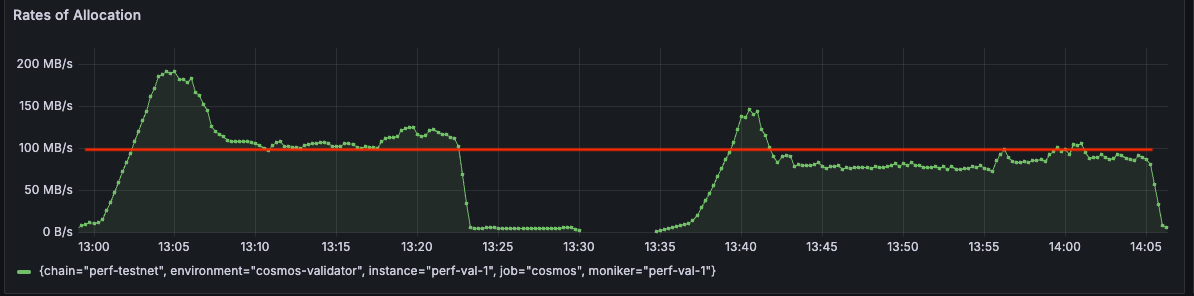
We implemented this fix in the cosmos-sdk. Our preliminary experimental data showed allocation rates going down by about 20% (left graph is MB/s allocated before the fix, right graph is MB/s allocated after the fix):
Excited by this, on June 3rd, we distributed a special build with the performance fix to validators and re-ran our load tests from April 22nd. The results are highly encouraging. Here’s an example:
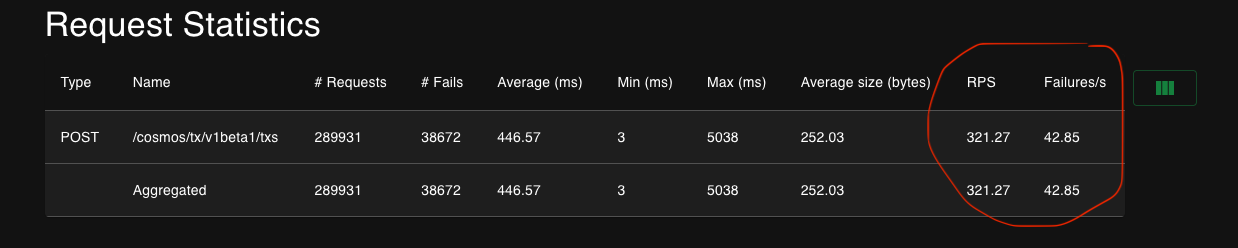
Notice how removing the top allocator in the application results in failures being more than halved. We’ve gone to about 278 successful requests per second, an improvement of about 35% in this benchmark. That, of course, is still only 4.4% of Mastercard, and the numbers get worse if we add more load. The following screenshot is from a benchmark using 9000 users instead of 2000:
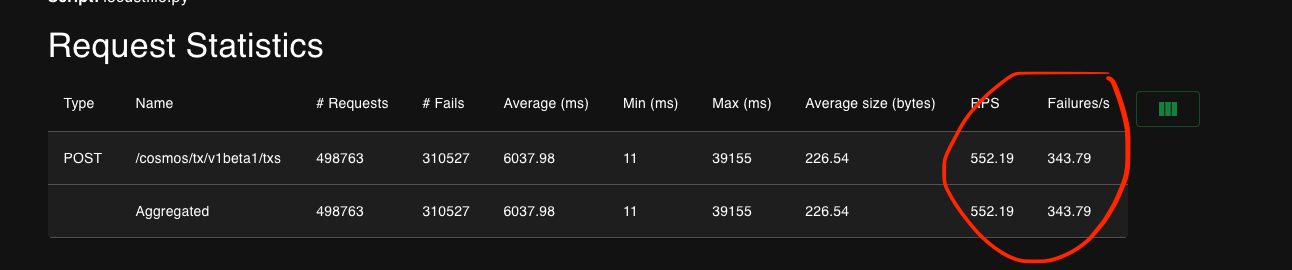
Note how the successful requests per second have gone down to 552 - 343 = 209. This shows how far we still are from being able to reach the scale of traditional finance organizations. The 552 RPS attempted on this test were enough to overload the locust host that generated them, and yet only represent 8.9% of the load that Mastercard processes successfully. We think there’re many more opportunities for memory optimizations like the one we’ve shown here. There is almost no reason for any allocations to take place during transaction processing: we should have all the memory already allocated from the previous transaction processed. That might not be enough to take us to Mastercard scale, but it would take us a lot closer. Close enough, maybe, to where it would stop being inconvenient for your local dive to have a crypto address you can deposit to. From there, we will have to keep optimizing if we want to keep drinking. Until then!